Resilience Monitoring and Impact Analysis in Humanitarian Responses
With 258 million people across 58 countries and territories facing critical levels of food insecurity, the global food crisis forces and inspires humanitarian agencies to redefine “working at scale.”
Because food security differs from household to household. It responds to seasonal trends, shocks, and recurrent stressors. The challenge of budgeting and designing a large-scale program that efficiently meets widely differing local circumstances dwarfs the already massive challenge of reaching more than a quarter billion people.
Then factor in a commitment to build resilience to future shocks that requires both global perspective and a clear picture of what individual households are experiencing on a regular basis.
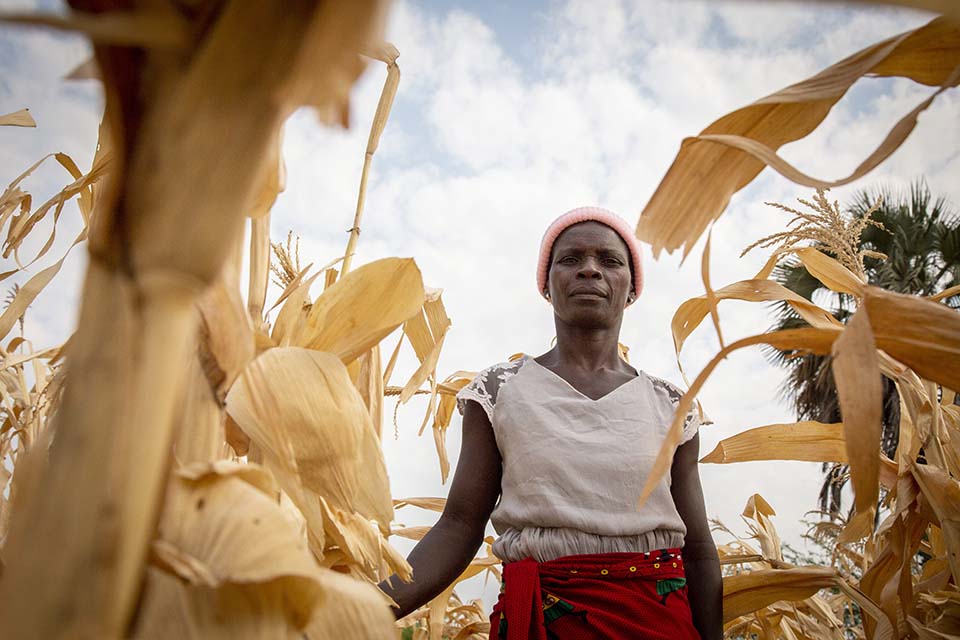
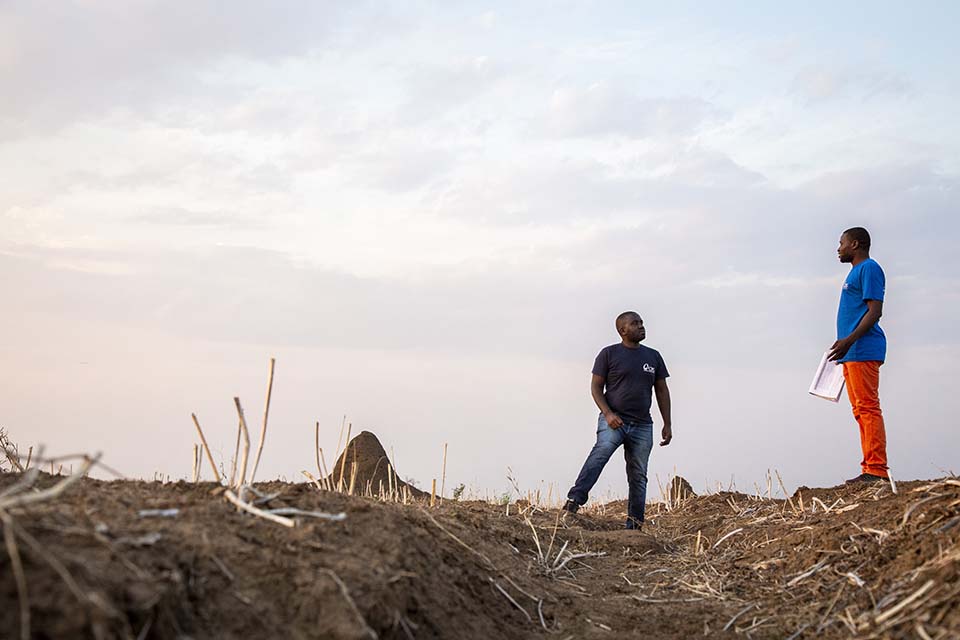
Nolifa Goche, a farmer and MIRA respondent stands in her dry maize farm in Billiat, Malawi. Many families in this area are subsistence farmers who depend on rains to grow crops. Weather patterns have become increasingly unpredictable.
Photo by Dooshima Tsee/CRS
MIRA — Monthly Interval Resilience Analysis — is the CRS’ tested approach to resilience monitoring at scale.
Developed by the agency's Southern Africa Regional Office team and Cornell University, MIRA provides years of food security, shock, and resilience data tracking for vulnerable communities and families.
First in Malawi, now in a growing number of countries, MIRA enables responders to work at scale while meeting very specific needs of individual communities. A key MIRA strength: data on community resilience comes directly from the community itself.
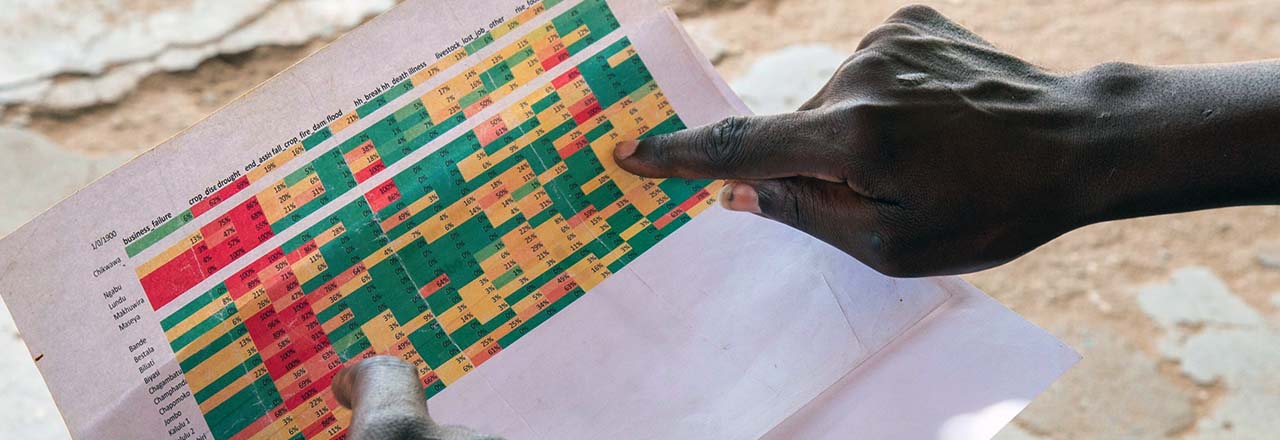
Beginning in 2016, over five years, three of Malawi’s most vulnerable communities used data they collected on the food security conditions in their community. Using mobile devices, they recorded the shocks households were experiencing. CRS received that data in near real-time, conducted analysis, and returned its findings to the communities in very simple terms. That information helped them identify acute shocks that needed immediate attention and lobby providers (like the government) for needed services.
Problems were expected. What raised eyebrows were the number of successes. Coupled with a list of knock-on benefits, the results sent a wave of excitement through the project team and outside observers.
Here was a way to know, in near real time, the effects of shocks on individual households and the wider community, then respond with solutions tailored to specific needs.
Break from past approaches
Designed to be taken to scale, MIRA has demonstrated the potential for shaping responses to massive shocks —such as the global food crisis — with increased awareness of diverse local needs. Its data also shows how communities respond to shocks and which interventions work best. That helps (responders) fine tune programming as needed.
“MIRA is a recurrent food security and resilience monitoring approach whereby community members, called enumerators, who we train, gather data from the same households every month, usually across a project zone,” said Austen Moore, senior technical advisor for resilience and global MIRA team lead. “Their data is analyzed or cleaned by us. Then we return it to them so they can make decisions.”
The tool represents a break from the familiar data gathering approaches of the past.
“The typical approach is to do an assessment after a shock or do regular annual surveys. But a lot can happen from one year to the next,” Moore said. “We really want to have a handle on how food security trends move in a community. Are they getting better, are they getting worse? What shocks are people experiencing and how is that affecting their food security?”
Monitoring shocks and food security
MIRA watches for shocks such as drought or flooding, human and livestock disease, and conflict. It also monitors human reaction to the shocks and how it affects food security. Depth and granularity of data features prominently in the approach.
“We look at their food-based coping strategies. Are they eating three meals a day? Are they supplementing cheaper foods for more expensive foods? Are they borrowing? Are they begging? Are they doing piece work for food? Those things often indicate a problem with food security,” Moore said.
Understanding current quality of life
MIRA tracks trends and reveals clear patterns of improvement or, following a shock, decline. Analysts compare that to expected food security for the year. If, after a harvest season, a community’s food security status is lower than expected for that time of year, that raises concerns for the coming lean season.
“Because we have enough data, we have a better chance to get out in front of humanitarian issues that might emerge,” Moore said.
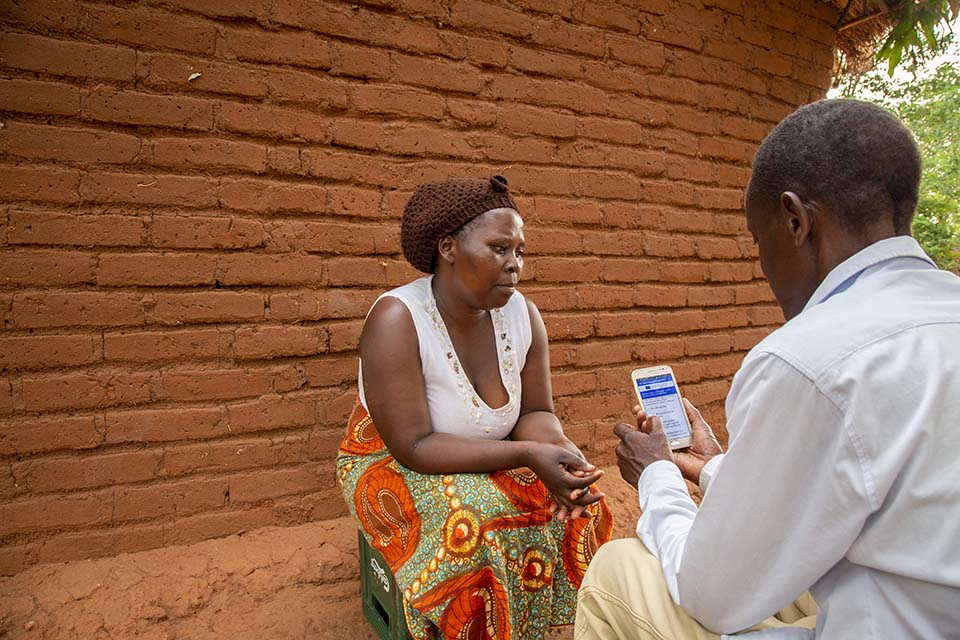
MIRA enumerator, Joe Aggrey Majausya, goes through survey questions with Sylvia Chinsamba, who has participated in the MIRA survey for three years. Changes in her community as a result of the data include community patrols to reduce crime and distribution of high quality seeds to plant in their fields.
Photo by Dooshima Tsee/CRS
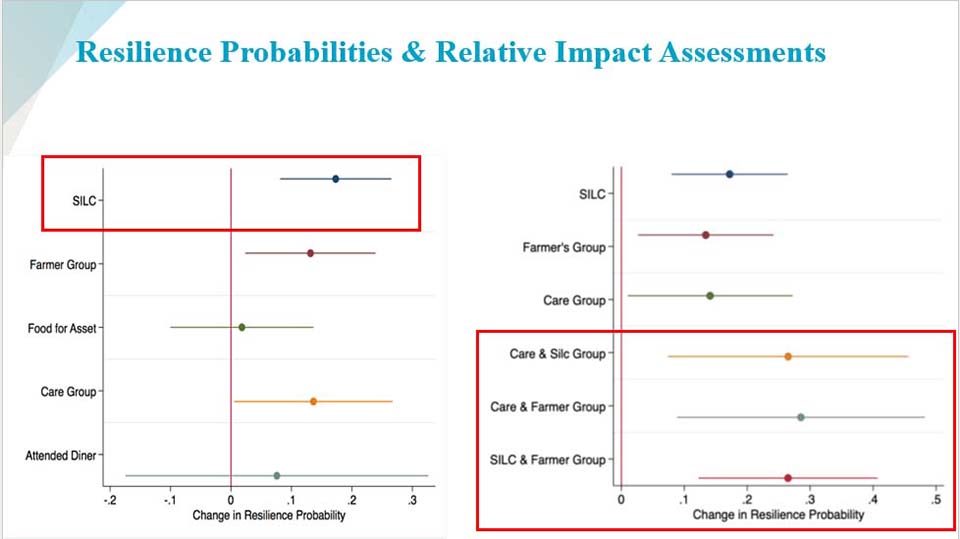
MIRA also tracks well-being trends and household characteristics such a male/female headed homes, number of children, education level, income sources, and interventions they may have received. MIRA analyzes what shocks are doing to food security and which interventions work best.
“Now we can put our investment toward the intervention that provided the largest benefit to the households. It allows us to be more agile.”
It also enables more impactful program design.
To go beyond a one-size-fits-all approach, CRS wanted a better sense of who are the most vulnerable, what caused vulnerability, and then track those communities and to respond as or before crises arise.
“A lot of our projects are development focused. People are supposed to be in a state of stability,” Moore said. “But if a shock comes and we don't respond to or know about it, we could be dealing with people that just simply can't participate in our other activities anymore.
“We needed to have a sense of what their life is really like on a month to month basis.”
CRS staff Patrick Tembo talks with Abraham Kambewa, a MIRA enumerator who collected and shared data from families in this community. Government and local leaders as well as several aid and non-profit organizations received and used the data to make decisions and inform programming.
Photo by Dooshima Tsee/CRS
Established technology, added value
While recurrent resilience monitoring was in its nascent stage, CRS committed to building MIRA. Early adoption, years of experience and a (5-year) case study ranked MIRA as an established and well defined approach.
“We have years of data and we've done all kinds of things in terms of adaptive management with it,” Moore said. “And we've done it in a way that isn't isolated to CRS.”
The data in the first MIRA project proved so valuable, CRS approached others who were planning to set up their own systems. CRS proposed a partnership around a single system that met everyone’s needs.
The EU opted to continue using it. Then the World Bank Office in Malawi approached CRS asking if its poverty monitoring tool could be integrated into MIRA. As a result, CRS created the Rapid Feedback Monitoring System to roll out the MIRA-World Bank collaboration.
With MIRA’s ties to the Malawi government, its data is shared with the country’s disaster management authority and connected to the social safety net program. But as a joint venture, it was designed to be a system that all projects under USAID’s umbrella could use — CRS’s and others.
“The World Bank was able to get this data they've used in many places.” Moore said. “And we've been working with World Bank in DC and USAID in DC to replicate this collaboration. It’s still confined to Malawi, but it can go anywhere. That's the vision for it.”
Granularity and feedback loop
While CRS is currently focused primarily on broader food security trends, on a more granular level, MIRA informs community project decision making. Community-based data collectors who collect information from households return the results to community leaders to discuss and interpret. They share simple reports with village development committees, savings groups, early warning committees, and many other local governing platforms, all of which have development objectives for the community and usually no way of funding those goals. They offer the vetted data as proof that help is needed and to justify taking action to provide that help.
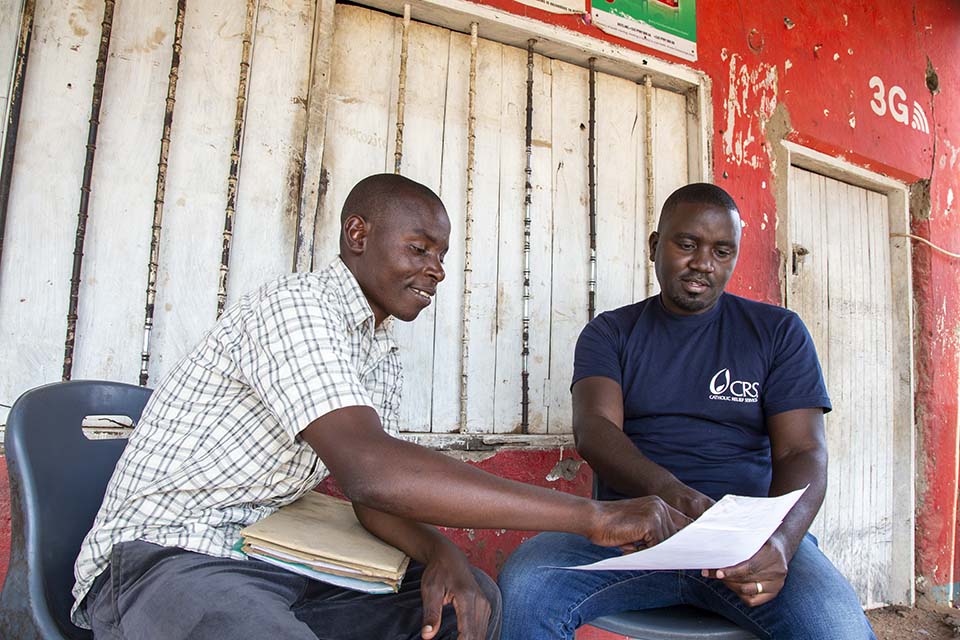
John Bande, MIRA enumerator, and Patrick Tembo, CRS staff discuss MIRA reports in Chikwakwa district, Malawi. Bande was a MIRA enumerator from 2016 to 2020. Using MIRA data, he worked with the village development committee and the civic protection committee to develop proposals that successfully received funding for their projects.
Photo by Dooshima Tsee/CRS
Using its data analysis, one community lobbied for construction of dykes and check dams that would reduce the impacts of floods
Several communities advocated for more seeds to plant vetiver grass or elephant grass or replant where it washed away. One community attributed data-based advocacy to receiving seeds, which then inspired further community action for planting and infrastructure development.
Post-flooding, communities advocated for construction of shelters that in one case resulted in construction of a huge communal evacuation center.
In two communities, NGO trained community members in the design and construction of flood-resistant houses with higher foundations as a precautionary measure. These communities saw a reduction in the number of houses destroyed by floods.
CRS and Cornell documented many such examples in a community impact study. In each case, a MIRA report revealed an issue and community members took it to their local government ministry. They shared their development plan and the evidence that proved the need.
In cases where officials were swayed enough by the evidence, they assisted. In cases where help was denied, some communities went ahead with the work themselves.
How it came together
Initially, MIRA data was shared using Excel spreadsheets that were sent to Cornell for analysis. The resulting PowerPoints, while sophisticated and visually appealing, often were not actionable. The team therefore decided to invest in developing Power BI dashboards to access the data insight in a more accessible, visual form. Now, each country in which MIRA has been implemented has its own dashboard. A next goal is to add a global dashboard to augment impact evaluation. And speed.
Shock mapping
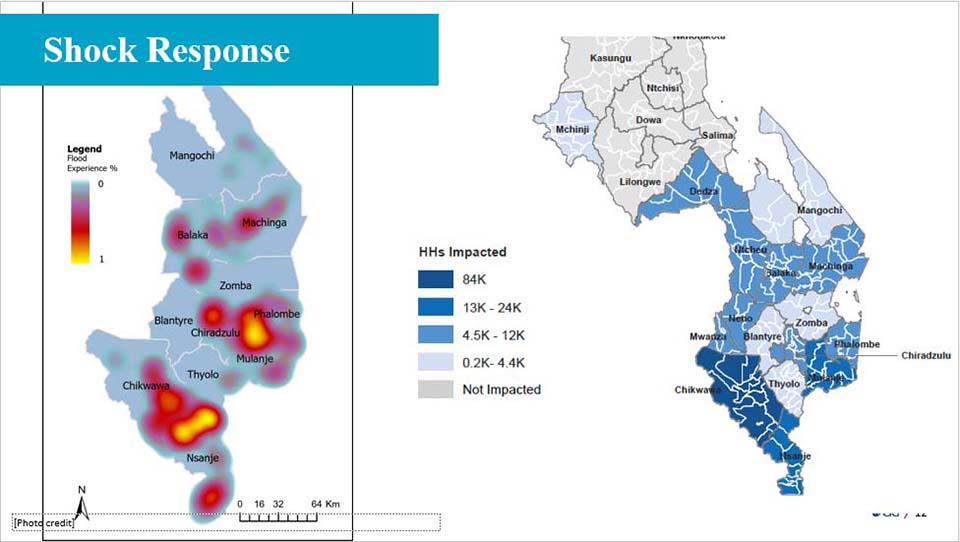
Key to speeding response is identifying problems sooner. To do that, the CRS ICT4D team developed shock mapping.
When cyclone Idai hit Malawi in 2019, enumerators, already in place, reached households right away. They determined who was affected and in what way. Their work produced a shock map that showed which communities were the most affected within 2 weeks of the cyclone hitting. Without MIRA, it took another team — Scrambling to hire staff and dealing with obstacles like washed out roads — months to create essentially the same map. The sooner, humanitarian response teams can get shock impact data, the sooner it can respond more rapidly to disasters and reach those households that are most affected.
“We can move more quickly because our people are on the ground already,” Moore said. “They're in the communities and there's a level of honesty in the responses because people see the value in providing accurate information because it will come back to them. It’s built-in incentive.”
What MIRA changed
Pre-MIRA, project designers based decisions on literature review and standalone assessments. It worked, but didn’t allow for much flexibility or targeting. Through use of mobile technology and effective data visualization MIRA enables our design to be even more targeted and agile. It also speeds removal of extraneous or confounding variables.
“We have a much better sense of the conditions in communities,” Moore said. “We have a much better sense of who's vulnerable and who's resilient. And we have a much better sense of what drives those outcomes. That allows us to be more focused in how we go about designing food security and resilience interventions.”
Mapping what's happening today against what should be happening shows more clearly where problems exist. Being able to more easily control for confounding variable speeds problem detection — where circumstances are deviating from expectations.


